実験条件や装置の構成、計算の前提や図面など、技術者は図を解説することが多い仕事です。普段から英語で話慣れているはずなのに、英語になるととたんに説明が難しくなります。
英語で説明ができないのは、単純に慣れていないからです。例文を見ながらキーワードとフレーズを知っておけば、日本語と同じように説明できるようになります。
本稿では、様々な図を説明する英文と、それに対する質問を英語・日本語で紹介します。なお、実験結果などのグラフを説明する英語 についても紹介していますので、よろしければそちらもご覧ください。
実験セットアップ 図を説明する English Sentence Japanese Translation The diagram represents a setup for an experiment. この図は実験のセットアップを表している。 A computer with a PC controller is connected to a CCD camera. CCDカメラにはPCコントローラを搭載したコンピュータが接続されている。 The structure is 30cm by 30cm and contains different layers labeled as GC, GDL, MPL, and CL. 構造物は30cm四方で、GC、GDL、MPL、CLとラベル付けされた異なる層を含んでいます。 There is also a micro syringe pump connected to a reservoir within the structure, pumping a non-wetting liquid. また、構造内のリザーバーに接続されたマイクロシリンジポンプが非濡れ性液体(シリコーンオイル+油性染料)をポンピングしています。 To the right of the structure are images of the materials corresponding to the layers. 構造物の右側には、層に対応する材料の画像があります。
図について質問する English Question Japanese Question Can you explain the purpose of the different layers within the structure, such as GC, GDL, MPL, and CL?構造内の異なる層、例えばGC、GDL、MPL、CLの目的を説明していただけますか? What is the role of the CCD camera in this setup?このセットアップにおけるCCDカメラの役割は何ですか? How does the micro syringe pump interact with the non-wetting liquid, and what is the significance of using a silicone oil and oil-based dye mixture? マイクロシリンジポンプは非濡れ性液体とどのように相互作用し、シリコーンオイルと油性染料の混合物を使用する意義は何ですか? What are the dimensions of each layer within the structure, and do they have specific thicknesses?構造内の各層の寸法はどれくらいで、特定の厚みはありますか? Could you provide more details on the materials shown on the right—how do they contribute to the function of the entire system?右に示された材料について、それらがシステム全体の機能にどのように寄与するか、詳細を教えていただけますか?
計算フロー
計算フローを説明する English Explanation Japanese Explanation The diagram presents a hybrid transient Computational Fluid Dynamics (CFD)-thermoelectric numerical model. この図は、過渡的な計算流体力学(CFD)-熱電数値モデルを提示しています。 It defines boundary conditions for both transient CFD and thermoelectric models, including states and geometry. 過渡状態のCFDモデルと熱電モデルの両方に対する境界条件を定義し、状態と幾何学を含みます。 Governing equations for the transient CFD model describe how fluid density, velocity, and temperature fields change over time. 過渡的CFDモデルの支配方程式は、時間とともに変化する流体密度、速度、温度場を記述します。 The transient thermal-electric model equations account for temperature gradients and electrical conductivities to describe the thermoelectric effect. 過渡的熱電モデルの方程式は、温度勾配と電気伝導率を考慮し、熱電効果を記述します。
計算フローについて質問する
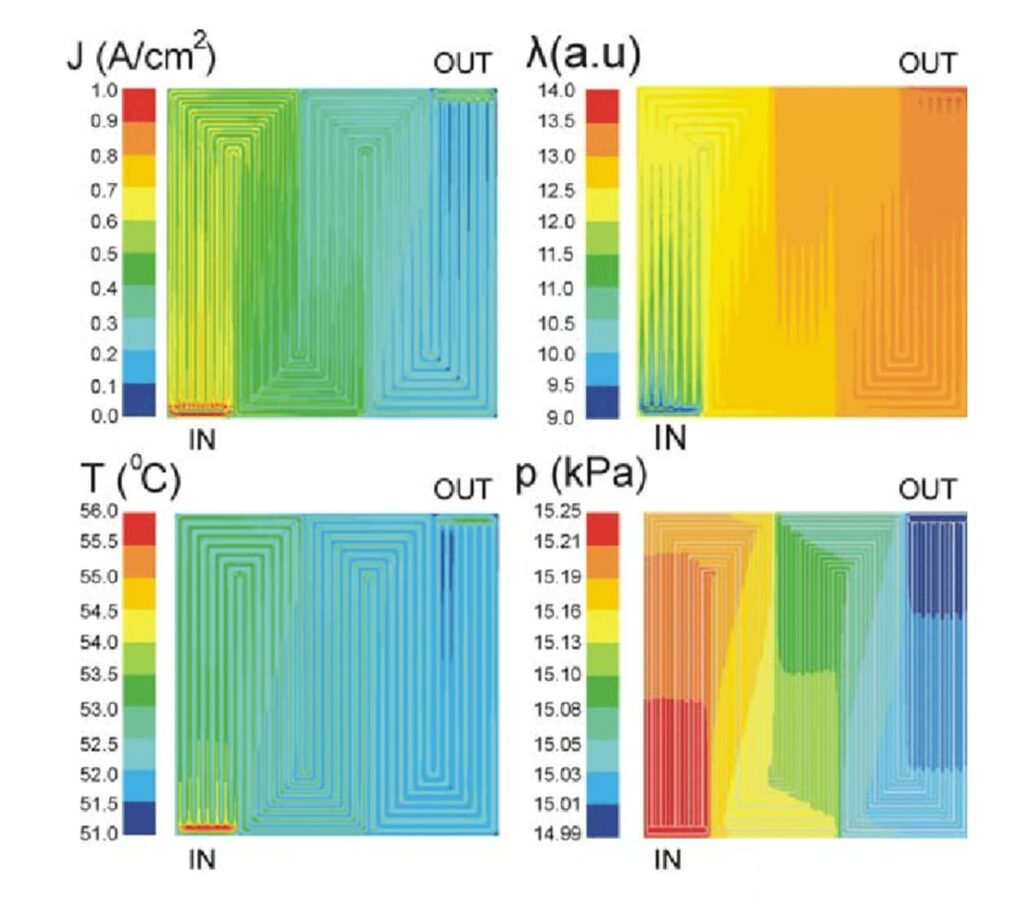
コンター コンターを説明する English Explanation Japanese Explanation The images are contour maps showing the distribution of four different variables. 画像は4つの異なる変数の分布を示す等高線図である。 Top left shows the current density in A/cm². 左上は電流密度(A/cm²)。 Top right shows the distribution of a variable λ in arbitrary units. 右上は任意の単位で変数λの分布を表す。 Bottom left shows the temperature distribution in degrees Celsius, with warmer colors indicating higher temperatures. 左下は気温の分布を摂氏で示したもので、暖かいほど気温が高いことを示す。 Bottom right shows the pressure in kilopascals, with contour lines closer together indicating steeper gradients. 右下はキロパスカル単位の気圧で、等高線が近いほど勾配が急であることを示している。
コンターについて質問する English Question Japanese Question In the current density map, why do we see such a uniform distribution? 電流密度マップでこのような均一な分布が見られるのはなぜですか? Why do all the graphs show striping patterns in certain areas? すべてのグラフに、ところどころに縞模様が見られるのはなぜですか? Regarding temperature, is the gradient seen here typical? 温度についてですが、ここで見られるグラデーションは典型的なものですか? What is the actual size of the object being represented in these maps? このマップで表されている実物のサイズはどのくらいですか? What do the IN/OUT labels indicate in this context? この文脈においてIN/OUTのラベルは何を示していますか?
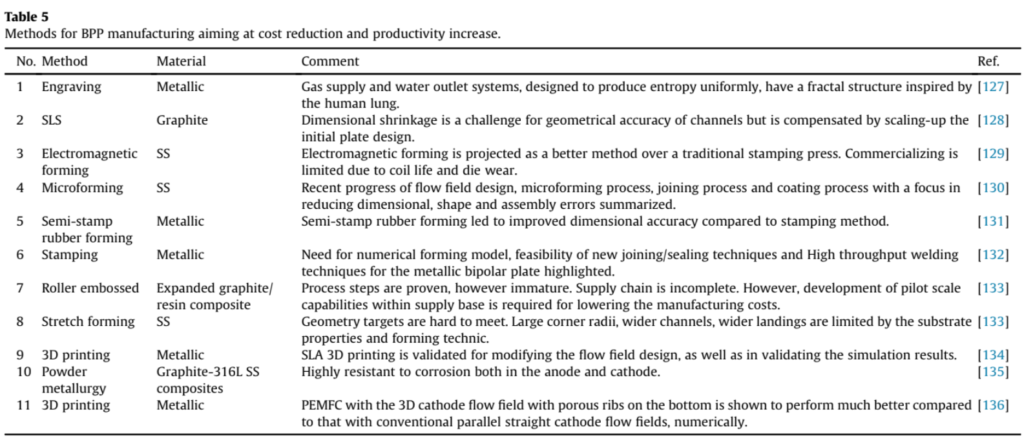
表 表を説明する English Explanation Japanese Explanation The table lists different manufacturing methods aimed at reducing costs and increasing productivity for BPP. この表は、BPP製造のためのコスト削減と生産性向上を目指した異なる製造方法をリストアップしています。 Each row specifies a method, the material used, a comment on the method, and a reference number for further reading. 各行には、方法、使用される材料、その方法に関するコメント、さらなる読書のための参照番号が指定されています。 Methods include engraving, selective laser sintering (SLS), electromagnetic forming, and more. 方法には彫刻、選択的レーザー焼結(SLS)、電磁成形などが含まれます。 Comments provide insights into the advantages and challenges of each method. コメントは各方法の利点と課題についての洞察を提供しています。 The materials range from metallic to graphite and stainless steel (SS), with some methods using composites. 材料は金属からグラファイト、ステンレス鋼(SS)まで多岐にわたり、いくつかの方法では複合材料が使用されています。
表について質問する English Question Japanese Question For the engraving method using metallic materials, what makes the design inspired by the human lung advantageous? 金属材料を使用した彫刻方法について、人間の肺に着想を得た設計が有利な理由を教えていただけますか? Could you elaborate on the challenges faced with dimensional shrinkage in SLS and how they are addressed? SLSでの寸法収縮の課題について、それにどのように対処されているのか詳しく教えていただけますか? Regarding electromagnetic forming, how significant is the coil life and die wear, and are there any developments to extend their life? 電磁成形において、コイル寿命とダイの摩耗の重要性はどれほどであり、その寿命を延ばすための開発はありますか? In microforming, what kind of improvements have been made in flow field design recently? マイクロフォーミングでは、最近、流れ場設計にどのような改善が加えられましたか? How does the semi-stamp rubber forming compare in terms of dimensional accuracy to the traditional stamping method? 半スタンプゴム成形は従来のスタンピング方法に比べて、寸法精度ではどのように比較されますか?
実験プロセス 実験プロセスを説明する English Explanation Japanese Explanation The diagram illustrates two separate but related processes for analyzing and optimizing materials: the ‘Metal support process’ and the ‘Half cell co-sintering process.’ この図は、素材の分析と最適化のための二つの別々だが関連するプロセス「メタルサポートプロセス」と「ハーフセル共焼結プロセス」を説明しています。 For the metal support process, it begins with the data of the metal substrate, which is used to create a dataset. メタルサポートプロセスでは、金属基板のデータから始まり、それを使ってデータセットを作成します。 The dataset undergoes a first round of modeling using a Random Forest Regressor, followed by hyperparameter tuning. 作成されたデータセットはランダムフォレストリグレッサーを用いた初回モデリングを受け、その後ハイパーパラメータチューニングが行われます。 The analysis phase includes shrinkage prediction and feature importance, which are key outputs of the process. 分析フェーズには、収縮予測と特徴重要度が含まれ、これらはプロセスの主要なアウトプットです。 The half cell process starts with experimental data of the half cell, forming another dataset for modeling. ハーフセルプロセスは、ハーフセルの実験データから始まり、モデリング用の別のデータセットを形成します。 This dataset is modeled using both a Random Forest Regressor and a Neural Network, and the results are compared. このデータセットはランダムフォレストリグレッサーとニューラルネットワークの両方を使用してモデリングされ、その結果が比較されます。 Power generation test data is then incorporated to derive insights, validate the model, and analyze the process. 次に、発電テストデータを取り入れて、洞察を得て、モデルを検証し、プロセスを分析します。
実験プロセスについて質問する English Question Japanese Question Can you explain how the initial data of the metal substrate is collected and what parameters are included? 金属基板の初期データはどのように収集され、どのようなパラメータが含まれていますか? How do you determine when hyperparameter tuning is sufficient for the Random Forest Regressor model? ランダムフォレストリグレッサーモデルのハイパーパラメータチューニングが十分であるとどのように判断しますか? What are the key features you’re looking for in the analysis phase, particularly in shrinkage prediction? 特に収縮予測において、分析フェーズで探している主要な特徴は何ですか? Could you walk us through how the models from the metal support process and half-cell co-sintering process are integrated? メタルサポートプロセスとハーフセル共焼結プロセスのモデルがどのように統合されているか説明していただけますか? What insights are we expecting to gain from comparing the Random Forest and Neural Network models? ランダムフォレストモデルとニューラルネットワークモデルを比較することから、どのような洞察を得ることを期待していますか?
制御 制御を説明する English Explanation Japanese Explanation This flowchart outlines a decision-making process for power distribution in a vehicle system. このフローチャートは、車両システムでの電力分配の意思決定プロセスを概説しています。 It starts with calculating the required power based on speed, slope, and acceleration inputs. スピード、傾斜、加速度の入力に基づいて必要な電力を計算から始まります。 Then it compares the required power with the maximum power from the engine and whether the state of charge (SOC) allows for power distribution. 次に、必要な電力をエンジンからの最大電力と、電力分配を許可する状態の充電(SOC)と比較します。 Depending on these factors, the flowchart decides if the vehicle should use maximum engine power, other power from the motor, or a combination of both. これらの要因に応じて、車両が最大エンジン電力、モーターからのその他の電力、または両方の組み合わせを使用すべきかを決定します。 There are conditional checks for power difference (∆P), acceleration condition, and charge state to determine the power source. 電源を決定するために、電力差(∆P)、加速状態、および充電状態に関する条件チェックがあります。
制御について質問する English Question Japanese Question Could you clarify what the ‘rotational speed’ and ‘SOC’ inputs specifically represent in this flowchart? このフローチャートにおいて、「回転速度」と「SOC」の入力は具体的に何を表していますか? When we talk about ‘required power’ and ‘maximum power from engine,’ how are these values determined? 「必要な電力」と「エンジンからの最大電力」とは、どのようにして決定されるのですか? What happens in scenarios where the power requirement exceeds the maximum power from the engine? 電力要求がエンジンからの最大電力を超えるシナリオでは、どのような対応をしますか? Can you explain the decision process between using engine power, motor power, or both? エンジン電力のみ、モーター電力のみ、または両方を使用するかの意思決定プロセスを説明していただけますか? How does the system respond when the acceleration condition is negative? 加速条件がマイナスの場合、システムはどのように対応しますか?
ChatGPTを活用した勉強法 これらグラフの説明と質問の英文、和訳はChatGPTで生成しています。
ご自身の興味のある分野の画像をコピペして、以下のプロンプトで英語・日本語をセットで生成できます。
この図表を短い複数の英文で説明して。 表現は伝わりやすいようにして。図の基本的な見方の説明を多めにして。 和訳とセットで表形式にして。
この図表をプレゼンした人に対して、気になる点をミーティング中の会話のように質問してみて下さい。 いくつか例を挙げてくれると嬉しいです。表形式にして。


コメント